
ข้อสอบวิทยาศาสตร์ สอบเข้า ม.1 EP พร้อมเฉลยเสริมความมั่นใจก่อนสอบ
ข้อสอบวิทยาศาสตร์ สอบเข้า ม.1 EP
1. Which cell structure do nutrients pass through to enter a cell?
2. A group of tissues that work together to perform a specific function is called
3. When food is being mechanically digested, it is being
4. The primary purpose of which human organ system is to produce hormones that regulate body functions?
5. Which gas is used by humans in the process of cellular respiration?
6. Which process occurs during the growth and development of a fertilized human egg?
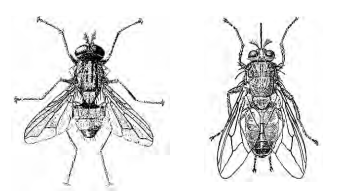
7. The diagram below represents two flies. They look similar but they can not sexually reproduce with each other and produce offspring.
This means that the two flies most likely belong to
This means that the two flies most likely belong to
8. Abnormal cell division results in
9. The carbohydrates, proteins, and minerals that are vital to an organism’s survival are found in
10. During the process of photosynthesis, green plants produce
Base your answers to questions 11 and 12 on the graphs below and on your knowledge of science. The graphs show the populations of rabbits with four different fur colors in one area. Graph A represents the population of rabbits 10 years ago. Graph B represents the population of rabbits today.
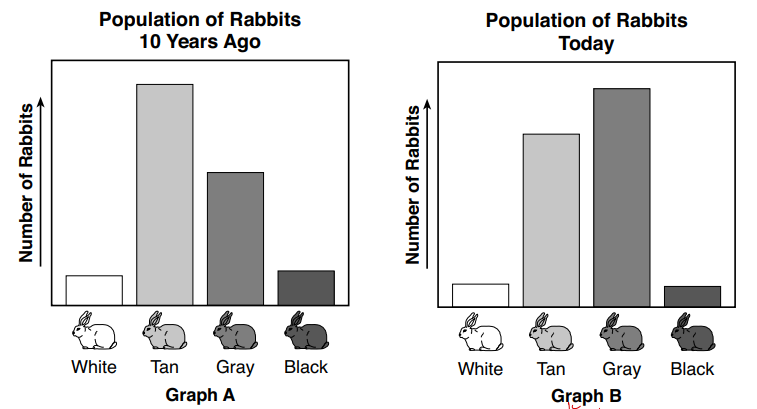
11. At the end of the 10-year period, which color of rabbit appears to be best adapted to its environment?11. At the end of the 10-year period, which color of rabbit appears to be best adapted to its environment?
11. At the end of the 10-year period, which color of rabbit appears to be best adapted to its environment?11. At the end of the 10-year period, which color of rabbit appears to be best adapted to its environment?
12. Variations in traits, such as the fur color of rabbits, may be caused by
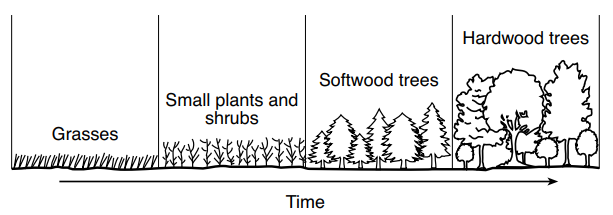
13. The diagram below represents changes in the types of plants growing in the same area during four different time periods. Different types of plants have been labeled for each time period.
This change in plant types over time is an example of
This change in plant types over time is an example of
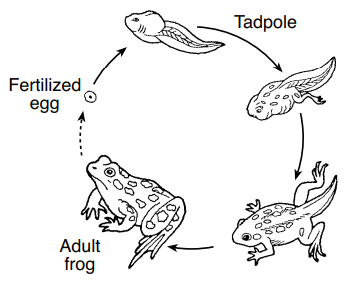
14. The diagram below represents the life cycle of a frog.
This diagram shows that, in frogs,
This diagram shows that, in frogs,
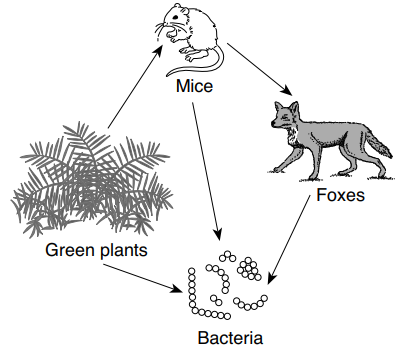
15. The diagram below represents a partial food web.
Which organisms in this food web decompose materials and recycle wastes?
Which organisms in this food web decompose materials and recycle wastes?
16. All of the plants and animals living in the same area make up a
17. Which change would most likely cause a decrease in the number of squirrels living in an area?
18. The passage below describes how a catalytic converter in a car works.
How a Catalytic Converter Works
Gases produced by a car’s engine flow through the catalytic converter, which contains metals. These metals start a chemical reaction that makes the gases released by the car less harmful to the environment.
The catalytic converter most likely was developed in response to
19. The formation of rock fragments and soil is most likely the result of
20. All matter is made up of
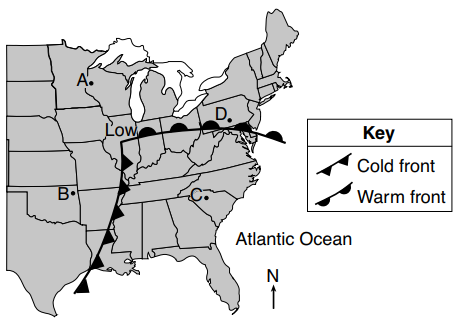
21. The weather map below shows a low-pressure system over the eastern United States. Points A, B, C, and D represent locations on Earth’s surface.
Which location is most likely experiencing rainy, unstable weather conditions?
Which location is most likely experiencing rainy, unstable weather conditions?
22. In New York State there is a greater chance of precipitation falling as snow in January than in March, because in January the Northern Hemisphere is tilted
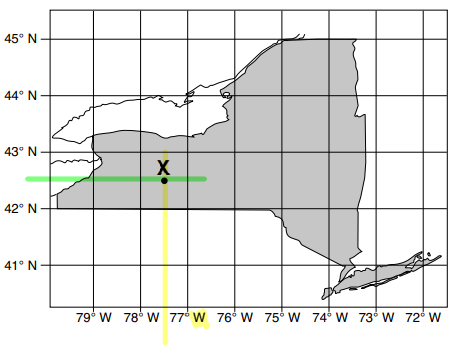
23. Point X on the map below represents a location in New York State.
What is the approximate latitude and longitude of location X?
What is the approximate latitude and longitude of location X?
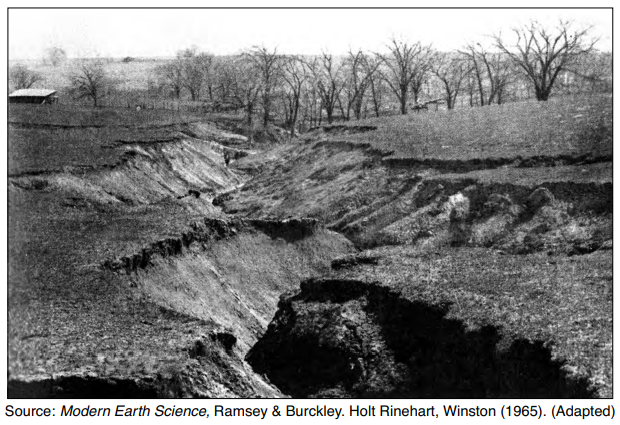
24. The photograph below shows a large, deep channel that formed as a result of running water that removed the soil.
Which process was responsible for the removal of the soil?
Which process was responsible for the removal of the soil?
25. The photograph below shows a test for a mineral property
Which mineral property is being tested?
Which mineral property is being tested?
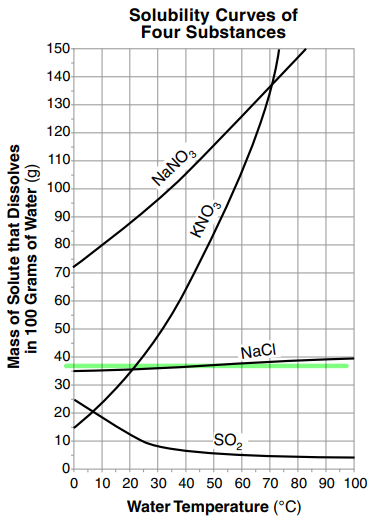
26. The graph below shows how water temperature affects the solubility of four different substances.
The solubility of which substance is least affected by the temperature of the water?
The solubility of which substance is least affected by the temperature of the water?
27. The movement of the liquid in a thermometer shows changes in temperature. An increase in temperature indicates the molecules in the liquid
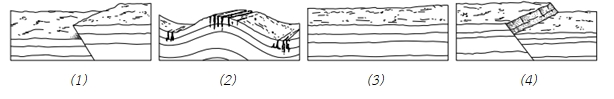
28. Which diagram represents folded rock layers?
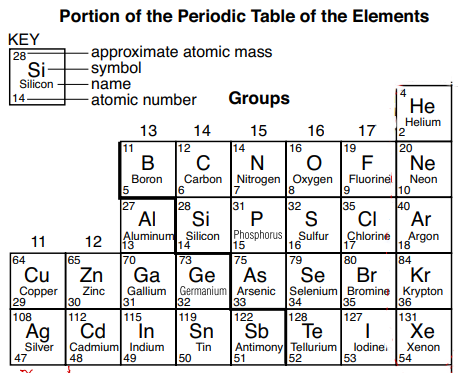
29. A portion of the Periodic Table of the Elements is shown below. The table provides a separate box for each chemical element, with all the elements in one vertical column having similar properties.
Which element is a noble gas?
Which element is a noble gas?
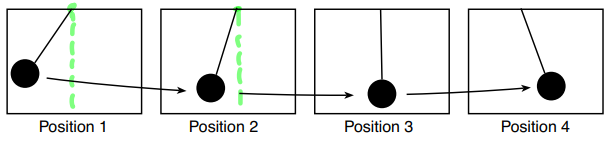
30. The diagram below represents the same pendulum in four different positions.
At which position does the ball have the most potential energy?
At which position does the ball have the most potential energy?
31. One characteristic that salt water and sugar-water have in common is, at room temperature, they are
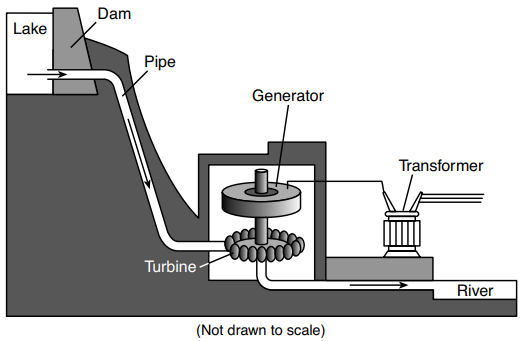
32. The diagram below represents parts of a power facility that are used to produce electricity
What is the major source of energy for the production of electricity in this facility?
What is the major source of energy for the production of electricity in this facility?
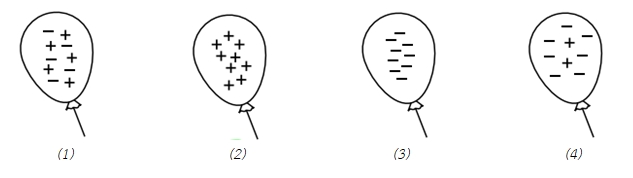
33. The illustration below represents balloon A, which has an electrical charge.
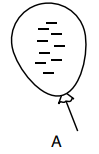
Balloon A would be most attracted to which balloon?
Balloon A would be most attracted to which balloon?
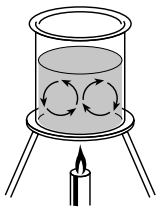
34. The diagram below represents a beaker of water being heated by a flame. The arrows represent heat transfer occurring in the beaker.
Which process is represented by the arrows in the diagram?
Which process is represented by the arrows in the diagram?
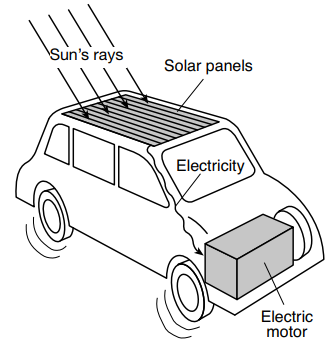
35. The diagram below represents energy transformations in a moving electric toy car.
Which form of energy is the original source of power for this car?
Which form of energy is the original source of power for this car?
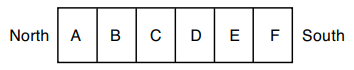
36. The diagram below represents a bar magnet. Six locations, A through F, are labeled on the magnet.
Which two locations on the magnet would have the greatest attractive forces?
Which two locations on the magnet would have the greatest attractive forces?
37. The Law of Conservation of Energy states that energy cannot be created or destroyed, but energy can change
Base your answers to questions 38 and 39 on the diagram below and on your knowledge of science. The diagram represents a person using a spring scale to pull a wooden block up a ramp.
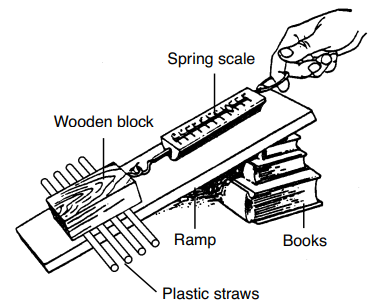
38. The plastic straws were placed under the wooden block to
38. The plastic straws were placed under the wooden block to
39. The ramp would be classified as which type of simple machine?
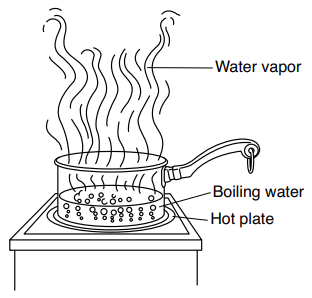
40. The diagram below represents liquid water in a pan on a hot plate. The liquid water is boiling and changing into water vapor.
The process of boiling is considered to be a
The process of boiling is considered to be a
Base your answers to questions 41 and 42 on the partial nutrition label below and on your knowledge of science. The label shows some nutritional information for a box of macaroni and cheese.
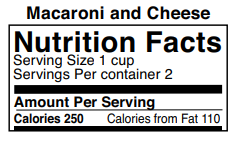
41. The Calories on a food label indicate the amount of energy the food contains in one serving. Which form of energy is contained in food?
41. The Calories on a food label indicate the amount of energy the food contains in one serving. Which form of energy is contained in food?
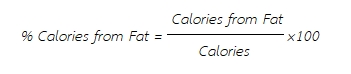
42. Nutritious food choices have less than 30% of their Calories from fat per serving. The equation used to calculate the percent of Calories from fat is given below.
What is the percent of Calories from fat in one serving of this macaroni and cheese?
What is the percent of Calories from fat in one serving of this macaroni and cheese?
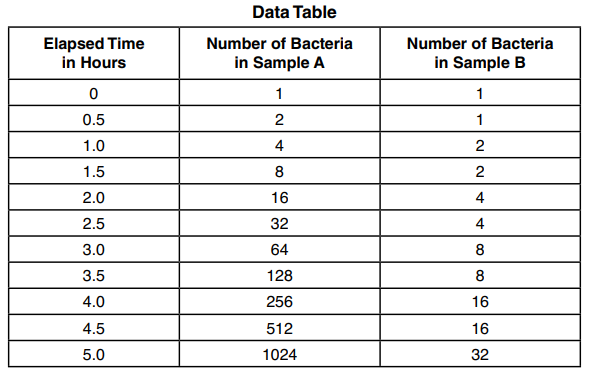
43. The data table below shows the number of bacteria in two samples, A and B, growing in a laboratory over a five-hour period. Data were collected every half hour.
If the pattern of growth continues, how many bacteria will be in sample B when six hours have elapsed?
If the pattern of growth continues, how many bacteria will be in sample B when six hours have elapsed?
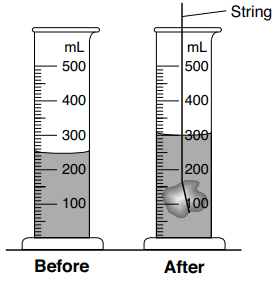
44. The diagram below represents a graduated cylinder containing water before and after a rock suspended on a string is lowered into it.
What is the approximate volume of the rock suspended in the graduated cylinder?
What is the approximate volume of the rock suspended in the graduated cylinder?
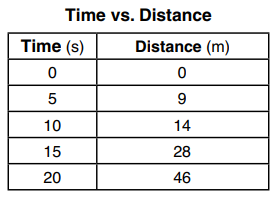
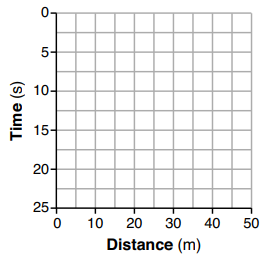
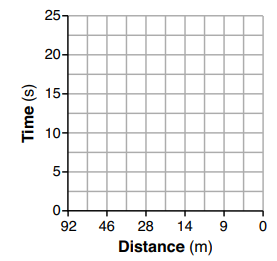
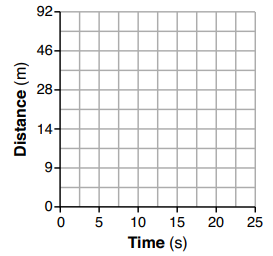
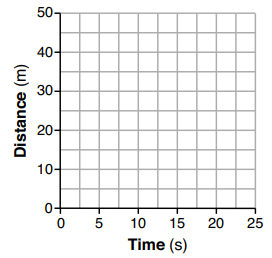
45. The data table below shows information gathered from a science experiment. Time was measured in seconds (s) and distance was measured in meters (m).
Which grid is correctly designed to show these data in a line graph?
Which grid is correctly designed to show these data in a line graph?
ข้อสอบวิทยาศาสตร์ สอบเข้า ม.1 EP
You got {{userScore}} out of {{maxScore}} correct
{{title}}
{{image}}
{{content}}