
GMAT Integrated Reasoning ทักษะด้านเหตุผล พร้อมเฉลย
GMAT Integrated Reasoning
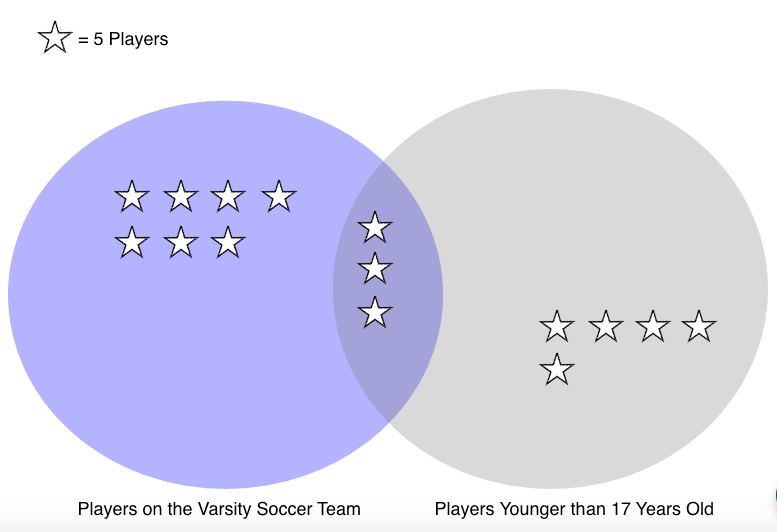
1.Refer to the pictograph that describes all of the students who play soccer at Douglas High School. Each star represents 5 students from a sample of 75 total students. Identify the missing information in the following statements using the pictograph. I. If one student is selected at random from the 75, the chance that the student will be older than 17 or on the Varsity team, or both is __________. II. If one student is selected at random from the 75, the chance that the students is both younger than 17 and on the Varsity Soccer Team is __________.
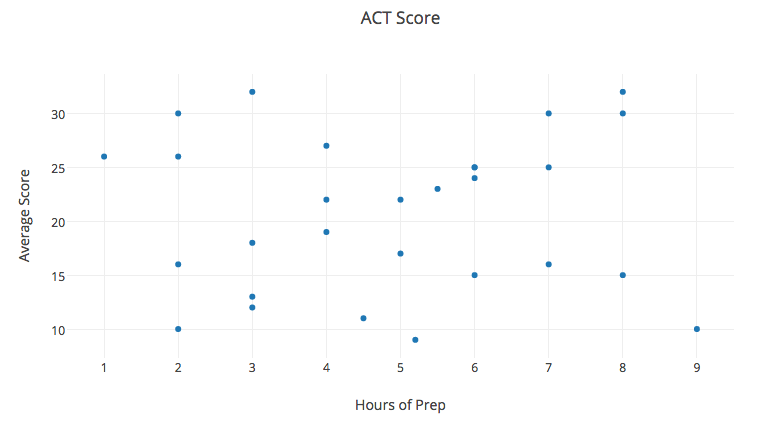
2.The graph depicts the hours prep time for students who took the ACT test and their corresponding average score. Identify the missing information for the following statements using the graph. I. The relationship between study time and test scores is __________. II. The slope of the regression line is __________ .
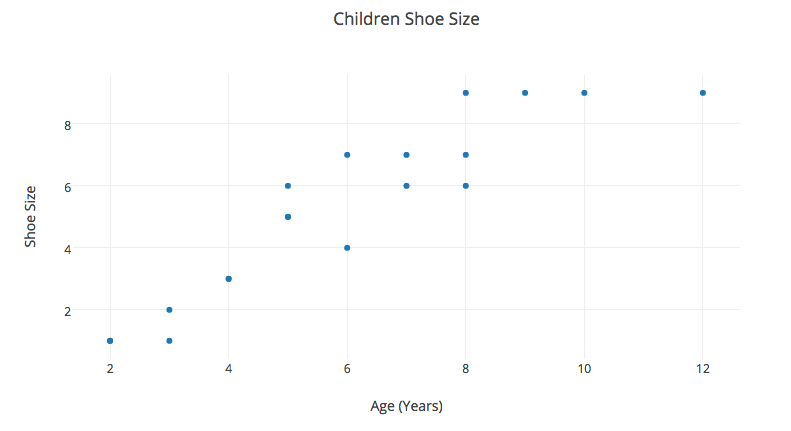
3.The graph above plots sixteen points that each describe the shoe size of sixteen individual children. Identify the missing information of the following statement. The relationship between the age of the child and the child's shoe size is __________.
GMAT Integrated Reasoning
You got {{userScore}} out of {{maxScore}} correct
{{title}}
{{image}}
{{content}}